Company Update
6 Reasons Why We’re Excited About The Next Ad Analytics
Sep 3, 2018
Company Update
Sep 3, 2018
The Next Ad is adding an awesome new feature which is going to become part of the current platform: The Next Ad Analytics. This brand new tool is going to make our customers’ lives far easier when it comes to visualising data. And you won’t have to pay a penny extra for it.

The Next Ad Analytics is the new way to review the performance of all the campaigns, ad sets and ads that you are managing within our application. Using our extensive template you’ll have access to a real-time full funnel overview for all the stakeholders inside or outside of your organisation. Consisting of visually attractive reports, extensive sharing options, easy customisations options and the best available in-class support from our team of experts, this tool will help you get the best campaign results whilst allowing you to benchmark all of your data in the most efficient way possible.
With the goal of providing easy to use reports, we have developed a feature that enables you to get insights on how your brand, campaigns and/or any other preference view are performing on our platform. With the user-friendly, real-time reporting dashboards of The Next Ad you will be able to customise templates according to your preferences and include The Next Ad’s custom metrics on top of the Facebook insights for professional reporting dashboards.
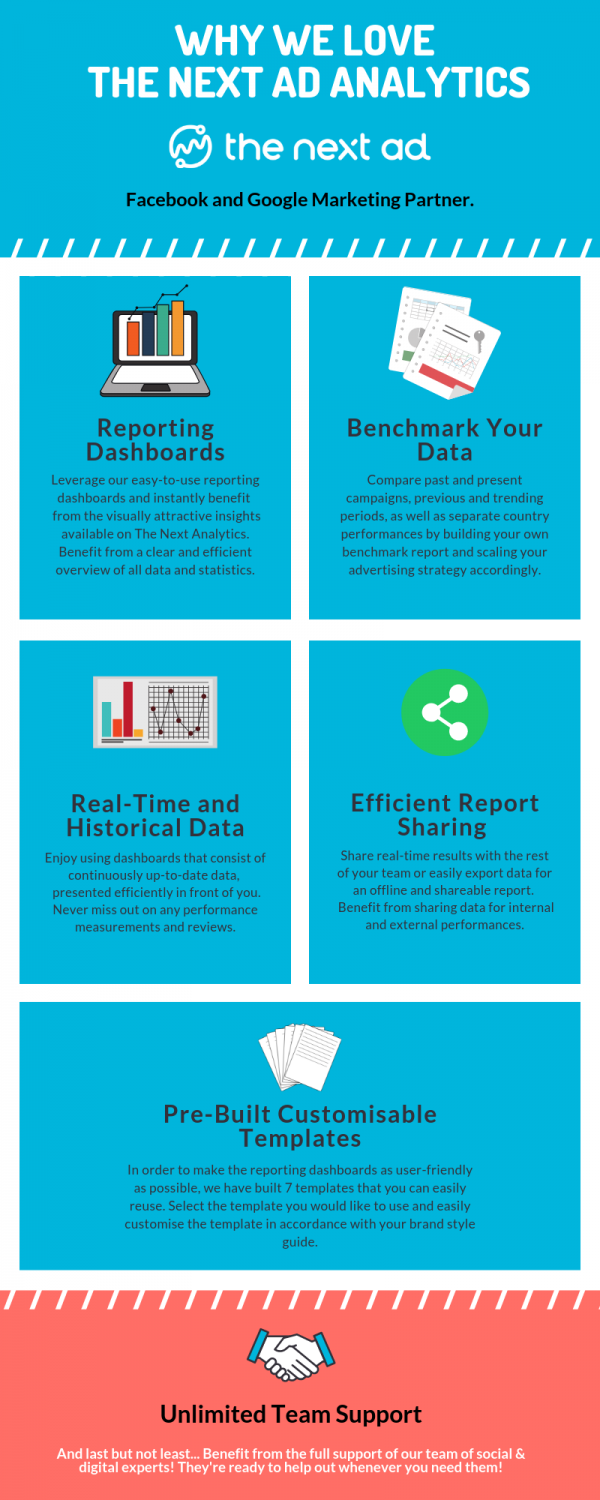
1. Easy and ready to go reporting dashboards.
It just takes a few minutes and you will be able to benefit infinitely from the visually attractive insights
2. Benefit from these The Next Ad unique metrics.
The Next Ad original Metrics, based on our customers’ feedback, is available on the dashboards.
3. Easily benchmark your own data.
Compare campaigns, previous/trending periods and country performances by building your own benchmark report and scale your advertising strategy accordingly.
4. Real-Time and Historical Data.
Dashboards where continuous up to date data is presented on the screens, enabling you to never miss out on performances.
5. Share reports with your Team.
Share the real-time views with your team or easily export the views for an offline and shareable report for internal or external use of performances.
6. The team is ready for you.
Benefit from full support on connecting data, building custom metrics, helping customising dashboards and more.
To make the use of the reporting dashboards as user-friendly as possible we have built 7 templates you can easily reuse. We can imagine you would like to show your management team different insights on social advertising performance than, for example, your social team is curious about. Select the template you would like to use and easily customise the template in accordance with your brand style guide (logo, colours, etc):
P.S. – Easily switch between campaigns or a period by using the set filters on top, enabling you to use the created template over and over again without rebuilding anything, saving you time and room for error.
Following the launch of the Home Dashboard, this is just the second step towards bringing all insights into one single platform. The reporting functionality opens up way more data connections without any barriers. We are working on getting your Google data onboard in our platform as well as combining insights of Search and Social. These insights will help you continuously improve your digital advertising strategies. Find some key benefits of unifying Search and Social here:
Curious about what we can offer and how that works? Get in touch with our team for more information and stay tuned!
Another highly useful option offered by The Next Ad Analytics is the ability to create and provide easy to use reports to its users. With the help of The Next Ad’s existing templates, users will be able to create easy-to-create templates which can be completely customised based on a user’s preference.
And we’re fully aware of the significant importance of measuring your performances. That’s why we’ve also added custom metrics to this tool, allowing you to scrutinise your results, act accordingly and plan for the next campaign.
We want to stress that The Next Ad Analytics will be part of the current platform, meaning it won’t be considered a separate tool, but rather an added feature to the platform. This means that users will not have to pay in order to be able to use this key tool.
To be able to use The Next Ad Analytics to its full extent, a bit of preparation will be required during the initial set up. Other than the tutorial video which includes step-by-step instructions, we have a team of experts ready to answer any questions you may have concerning this new addition to the platform. You can always reach out to the Support Team via the chat and they will be more than happy to help you out.
Want a visual overview of the significance of a sophisticated analytics software such as The Next Ad Analytics? Check out this one sheet that we created which truly summarises the importance of using advanced, embedded analytics.
We’re very excited about the release of this feature and we firmly believe it can only improve the quality of our platform and the service that we offer to our customers. We can’t wait to get some feedback from our users! And as always, please do not hesitate in contacting us if you have any concerns or problems with this new tool. Our team of experts would be more than happy to answer any questions you may have, either via the chat or on success@tnasuite.com.